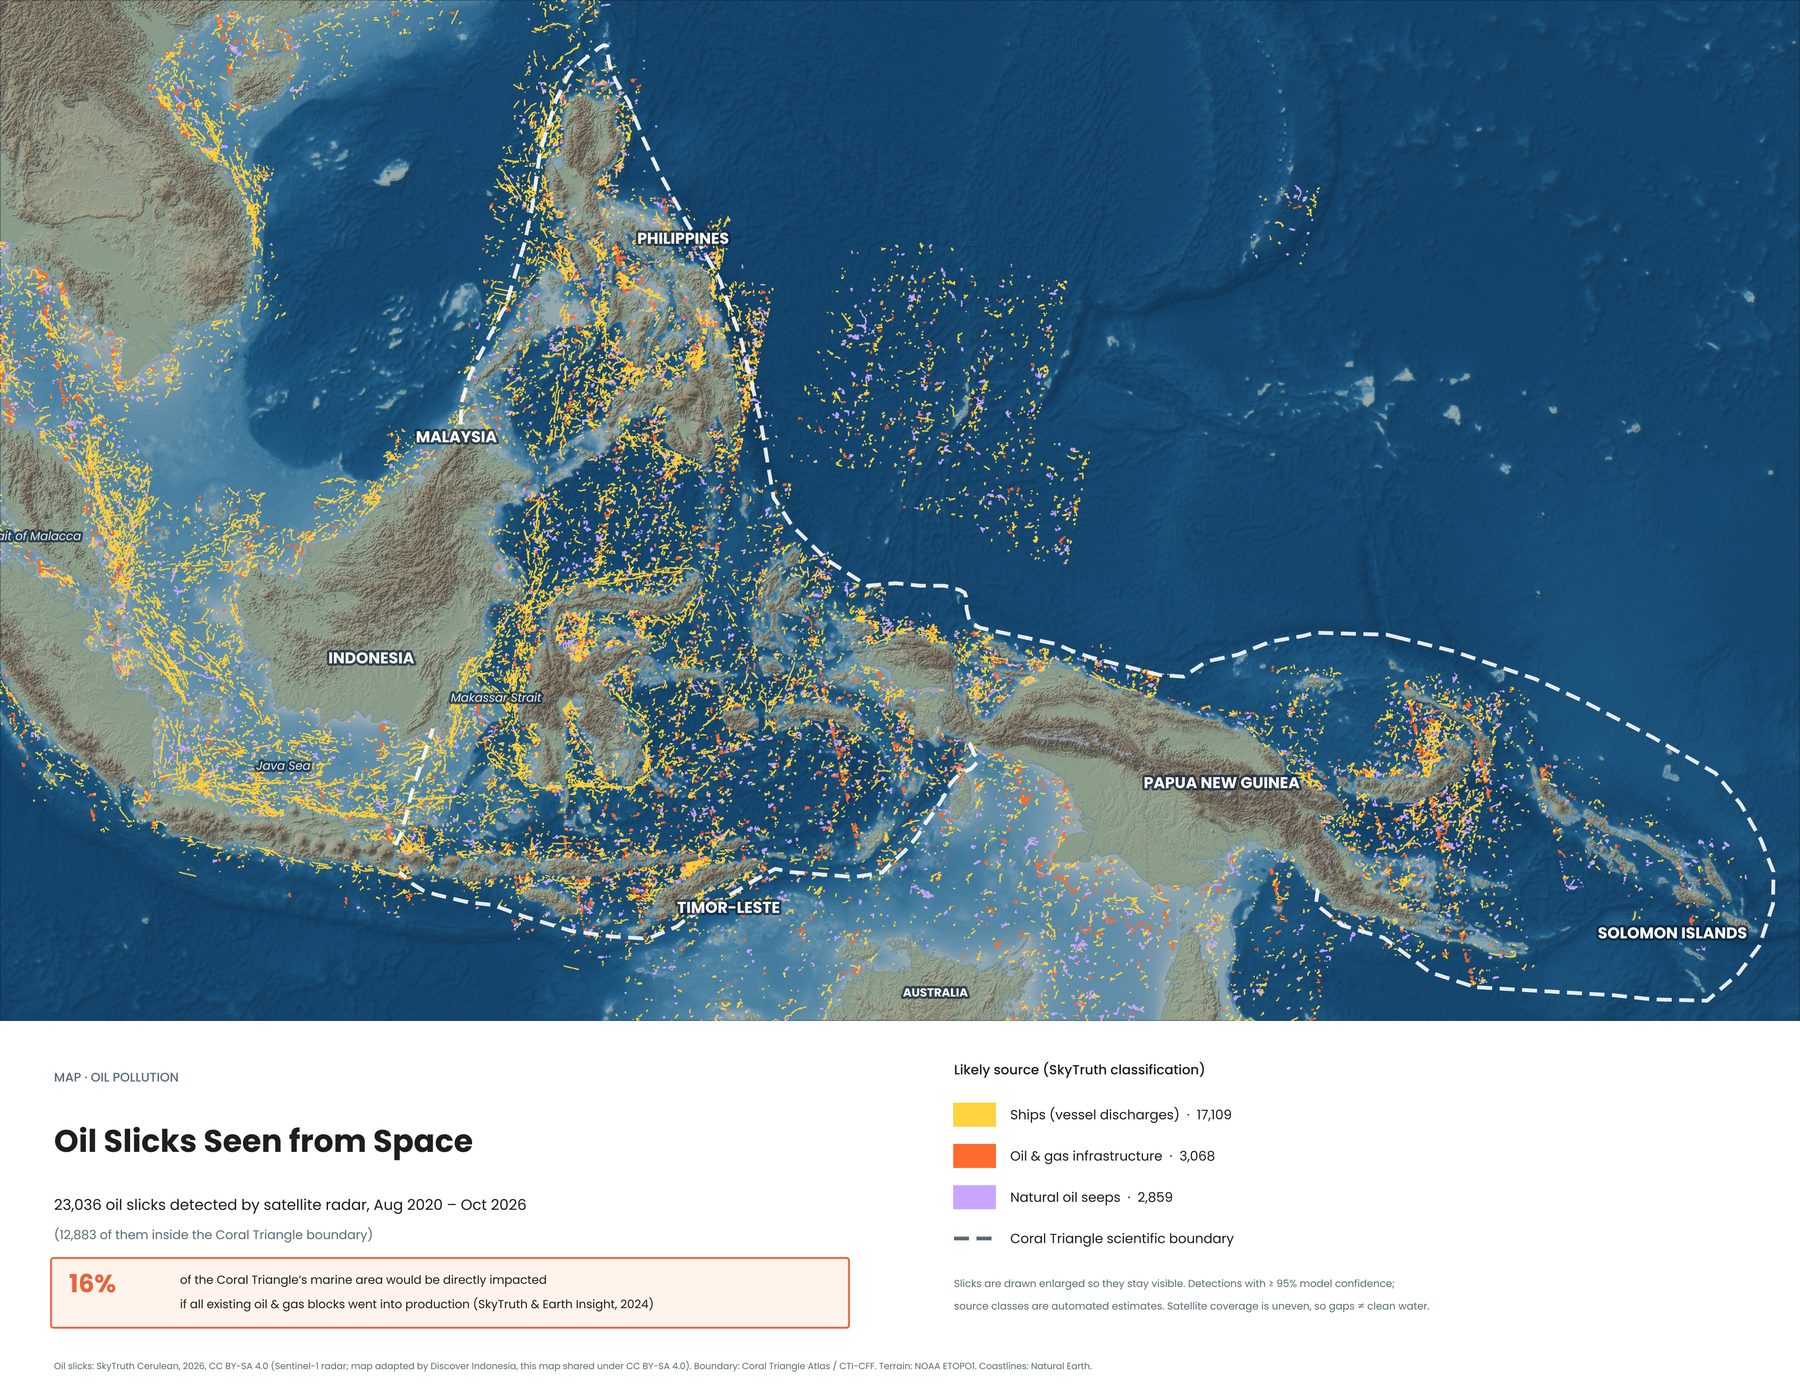
Oil on the sea surface is hard to spot from a boat, but satellite radar sees it clearly. Between August 2020 and October 2026, the Cerulean project by SkyTruth detected 23,036 oil slicks in the waters around the Coral Triangle, 12,883 of them inside its boundary.
How oil shows up from space
The European Sentinel-1 satellites send radar pulses down to the sea. Wind ripples on the water reflect the signal back. An oil film smooths out those ripples, so it shows up as a dark streak on the radar image. SkyTruth's Cerulean system scans these images automatically and estimates where each slick probably came from.
Where the slicks come from
| Ships | 17,109 slicks, most likely from vessels discharging oily waste at sea |
|---|---|
| Oil & gas infrastructure | 3,068 slicks near platforms and pipelines |
| Natural seeps | 2,859 slicks from oil leaking naturally from the seabed |
The densest lines follow the region's busiest shipping lanes: the Strait of Malacca, the Java Sea and the Makassar Strait. Source classes are automated estimates, and satellite coverage is uneven, so areas without slicks on the map aren't necessarily clean.
The bigger risk: new oil and gas blocks
SkyTruth and Earth Insight also mapped the oil and gas blocks already licensed in the region. They estimate that 16% of the Coral Triangle's marine area would be directly affected if all existing blocks went into production.
Why it matters for reefs
Oil can smother corals and the larvae that settle on reefs, and its toxic compounds harm fish, turtles and seabirds. Mangroves and seagrass meadows along the coast are especially vulnerable, because oil collects in sheltered, shallow water. See where the reefs, seagrass and mangroves are →
See all eight Coral Triangle maps →
Sources
- SkyTruth Cerulean (Sentinel-1 radar), 2026, CC BY-SA 4.0. Detections with at least 95% model confidence
- SkyTruth & Earth Insight (2024), oil and gas blocks in the Coral Triangle
- Boundary: Coral Triangle Atlas / CTI-CFF. Terrain: NOAA ETOPO1. Coastlines: Natural Earth